Introducing shp2svg
A new open-source tool for converting GIS shapefiles into SVGs.
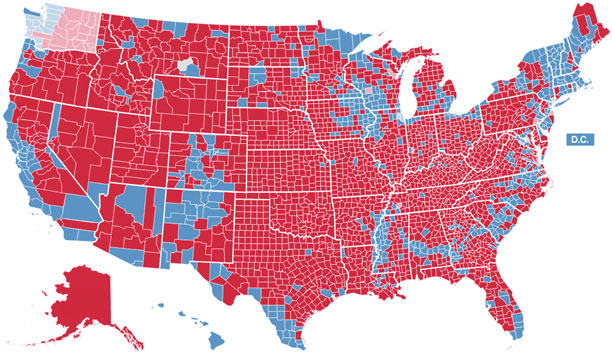
One of the larger projects the Data Desk tackled this year was visualizing the 2012 presidential election results. First, we built county-by-county results maps of each state for the GOP primary. Then, for the general, we had a more sophisticated presentation with a state-by-state map, a cartogram and a national county-by-county map.
To render the maps we chose to use a JavaScript library called Raphael, which uses SVG in modern browsers and falls back to VML in Internet Explorer 8 and below. Raphael was an excellent solution for us because it’s a relatively lightweight library, and the maps can be rendered quickly not only on the results detail page but also on widgets on the latimes.com homepage and mobile homepage. It renders the maps beautifully and simply, on a plain background, and in a way that lets the data shine without visual interference from geographic features, roads, buildings or street names.
Raphael is excellent at what it does, but it’s not a mapping library like Leaflet and can’t handle raw geographic data and map projections easily like D3. So one of the primary challenges throughout the development of our maps was turning GIS shapefiles into SVG paths that Raphael could handle.
Enter shp2svg
Today we’re announcing the release of shp2svg, an open-source Django-powered website that streamlines and simplifies the conversion of GIS shapefiles to SVG paths. It allows you to upload a SHP file (along with the DBF, PRJ and SHX files that come with it) and spits back SVG paths as JSON or an editable SVG file. You can render the paths at virtually any size and with any one of the several thousand map projections included with PostGIS.
It’s designed with SVG libraries like Raphael in mind, so it only supports converting polygons and multipolygons into SVG path elements. At this time shp2svg does not support other features in shapefiles, like points and polylines, though it may in the future. To aid in the creation of proportional symbol maps, shp2svg can also include the centroids for each polygon.
What’s in the box
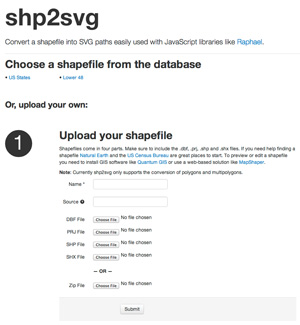
Shp2svg is being released as a product that developers can host locally for internal use, similar to the Panda Project. It includes a fully functional front end built with Bootstrap, which can handle uploading new shapefiles to the database or generating new SVGs using existing shapefiles. Shapefiles can be uploaded as individual components or zipped.
The Times is not currently hosting shp2svg on the Web for public use, though other developers are certainly welcome to do so. If you have any questions about how to get set up check out the readme or contact me.
How we did it
The site is built with GeoDjango, which makes it easy to load geographic data into a database, query it and manipulate it. When a user uploads a shapefile to the site, the files are stored on a parent model called ShapefileContainer. Then, using DataSource, we loop through all of the polygons and multipolygons in the shapefile, convert the polygons to multipolygons for consistency and store each one on a child model called Shape.
Once this is done, we can access the group of Shape objects as a GeoQuerySet and use Django to project them and extract their coordinates for conversion into SVG paths.
Django allows you to easily extract the coordinates from a multipolygon like this:
>>> Shape.poly.coords
((((-12139744.795340238, 5012635.741547457), (-12138858.895844406, 4439094.57990306), (-12300383.11008835, 4440128.263675176), (-12514270.312389202, 4440420.01845591), (-12693820.280335575, 4438284.271136337), (-12694231.590815783, 5159949.186691979), (-12362056.671742627, 5161218.638162391), (-12362528.384461187, 5016462.986205476), (-12139744.795340238, 5012635.741547457)),),)
But, as you can see, it can be difficult to figure out what’s going on. Each tuple like this “(-12139744.795340238, 5012635.741547457)” is a pair of X-Y coordinates that you could plot on a graph. Since we’re storing each item as a multiploygon, each individual polygon within it is represented here as a tuple of tuples. Each polygon tuple is nested in another, giant tuple for the whole multipolygon. For example, each island of Hawaii could be a set of coordinates in the multipolygon of the whole state.
These coordinates are large and unwieldy, and they change dramatically depending on which projection and/or coordinate reference system you’re using. So in order to translate these coordinates into pixels, we need to scale them down and convert them appropriately. To start off we need to pull out max and min X and Y coordinates, or the “extent” of the shapefile:
# make lists for the x and y coords
x_coords = []
y_coords = []
# loop through our GeoQuerySet of projected shapes
for i in projected_shapes:
    # grap the extent for each multipolygon
    coords = i.poly.extent
    # and append that to our master lists
    x_coords.append(coords[0])
    x_coords.append(coords[2])
    y_coords.append(coords[1])
    y_coords.append(coords[3])
    # then, we can get the extent for whole shapefile by grabbing the
    # max and min values for each list
    extent = (min(x_coords), min(y_coords), max(x_coords), max(y_coords))
Then, we use the extent to calculate a constant we can use to scale the coordinates to a screen resolution.
# Get the absolute difference between the largest
# and smallest x and y coordinates
max_translated_x = abs(extent[2] - extent[0])
max_translated_y = abs(extent[3] - extent[1])
# Use the user-supplied "max_size" to determine the scaling constant
if max_translated_x > max_translated_y:
    scale_factor = max_size / max_translated_x
else:
    scale_factor = max_size / max_translated_y
Finally, we can loop through all of the multipolygons in our GeoQuerySet, extract the coordinates, translate them to 0, 0 on the X-Y axis (so they appear in the top left of the SVG canvas) and multiply them by our scaling constant. Once we have a set of translated and scaled coordinates we can feed them into this function to convert them to an SVG path:
def coords_2_path(coord_list):
    """
    Takes a list of coordinates and returns an SVG path
    """
    if len(coord_list) == 1:
        path = 'M%s,%sZ' % (coord_list[0][0], coord_list[0][1])
    else:
        path = 'M%s,%s' % (coord_list[0][0], coord_list[0][1])
        for i in coord_list[1:]:
            path += 'L%s,%s' % (i[0], i[1])
        path += 'Z'
    return path.replace('-0.0', '0').replace('0.0', '0').replace('.0', '')
There’s a bit more to it than this, but you’re welcome to check out all of the code in the GitHub repo for this project.
What you can do
If you have any ideas for features or encounter any bugs, you’re welcome to submit a ticket on GitHub. Or, if you want to help the project along, here are some features we could use:
- Add support for points and polylines in shapefiles
- Add support for shapefiles with multiple layers
- Add support for projecting shapefiles with custom PROJ.4 strings