
Introducing Quiet L.A.
A new open-source template for a muted base map about Southern California, and the lessons we learned making it
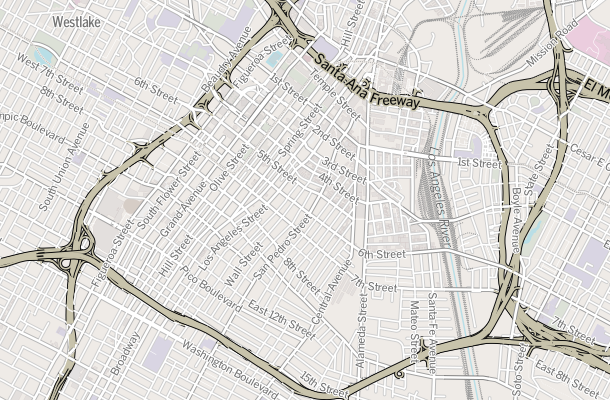
Today we announce the release of Quiet L.A., a free and open-source base map for Southern California. It is designed to serve as a muted backdrop for overlaying data visualizations. We put it to use Wednesday with this interactive map of 911 response times across the city of Los Angeles.
The most popular online maps are intended to provide driving directions. That encourages filling up space with as many labels and landmarks as possible, which is useful when you’re finding your way around town, but distracting when you want to focus on a data overlay.
The goal of Quiet L.A. is to remove extraneous detail, but retain enough information for the region to remain recognizable. It was developed using MapBox’s excellent map design studio, TileMill.
We are releasing the code we used to design and deploy the map, available here on GitHub, with the hope that it might be of help to others and with the faith that the open-source development process will lead to improvements we can benefit from. We know it has flaws, but we’re putting it out there.
What’s in it
The map is generated entirely using open data. Roads, buildings, waterways and landuse designations are provided by OpenStreetMap, a free database that could be fairly called the Wikipedia of maps. The locations and labels for cities and other places are provided by the U.S. Census via a data portal published by Investigative Reporters and Editors. Los Angeles regions and neighborhoods are provided by The Times’ own Mapping LA project, which was built out of a crowdsourcing collaboration with Times readers.
What we learned
The main lesson we learned in this project is to approach developing a map like any other Web application. That means:
Use version control
A TileMill project can be tracked in version control software such as Git just like any other software project. You reap the same benefits and all that’s required is you connect your local version of the repository to TileMill’s project directory, which can be done with a standard symbolic link.
$ ln -s /path/to/this/repo/quiet-la /path/to/Documents/MapBox/project/
Break goals down into small, manageable tasks
Coloring in lakes, labeling mountain ranges, picking icons for fire stations or fine-tuning highway shields can all be achieved one by one. It’s best to make a long list of all the improvements you’d like to make and tackle them one at a time. A lot goes into even a simple map and it can be overwhelming if you try to tackle everything at once.
One approach we like is treating every zoom level in your map as a separate feature and then perfecting them one at a time. Today’s release of Quiet L.A. provides only six zooms, but adding more is something we aim to do gradually in the future.
Package to distribute
Look at upgrades to your map tiles the same way you would a software package. Assign a number to each release. Then automate the process of deploying a new version. We accomplish this by using Fabric, the deployment tool we typically use to roll out changes to our Django Web applications.
When we’re ready to upgrade, we visit the settings for our TileMill project and increase the version number stored there. Then the following Fabric function uses TileMill’s command-line tools to export a new tile set.
def build_tiles():
    """
    Create a set of tiles so it can be deployed.
    """
    print('Building map tiles')
    # Have TileMill build the current project as an mbtiles file
    local('%(tilemill)s export quiet-la ./%(release_name)s.mbtiles --format=mbtiles' % env)
    # Crack open the mbtiles file as a directory
    print('- Opening mbtiles file')
    local('mb-util ./%(release_name)s.mbtiles %(release_name)s' % env)
    print('- Deleting mbtiles file')
    local('rm -rf ./%(release_name)s.mbtiles' % env)
    print('- Deleting export log')
    local('rm *export*')
    print(green('Success!'))
This next Fabric function takes that directory and uses Christopher Groskopf’s ivs3 tool to upload the tiles to our hosting provider, Amazon S3.
def deploy_tiles():
    """
    Upload a release folder to Amazon S3 buckets
    """
    print('Deploying tiles to Amazon S3')
    for bucket in env.tile_buckets:
        print('- Uploading files to %s' % bucket)
        local("ivs3 -P %s %s/%s" % (
            env.release_name,
            bucket,
            env.release_name,
            )
        )
    print('- Deleting file directory')
    local('rm -rf ./%(release_name)s' % env)
    print(green('Success!'))
Don’t repeat yourself
We also automate other common tasks, like updating our California slice of the OpenStreetMap database and bootstrapping the project on a new machine. You can find all our tricks in the GitHub repository.
What you can do
If you’d like to participate in improving Quiet L.A., here are a few ideas:
- Work on configuring the existing features for a new zoom level.
- Fork the repository and apply our style to your area.
- Help us further refine how we query roads at each zoom level.
- Improve the display and size of waterway labels at each zoom level.
- Query and style a landuse type you think we ought to add.
- Spot something ugly and point it out.
Much respect due
The technical design of Quiet L.A. is heavily borrowed from MapBox’s excellent osm-bright. The cosmetic design is modeled on a 2008 map of Orange County election results by Thomas Suh Lauder. The code was developed on top of a groundbreaking foundation by my colleague Ken Schwencke.